What you deserve as a donor
As a donor, you should always partner with a trustworthy charity who is accountable, transparent, and delivers impact and results.
Low overhead means high impact
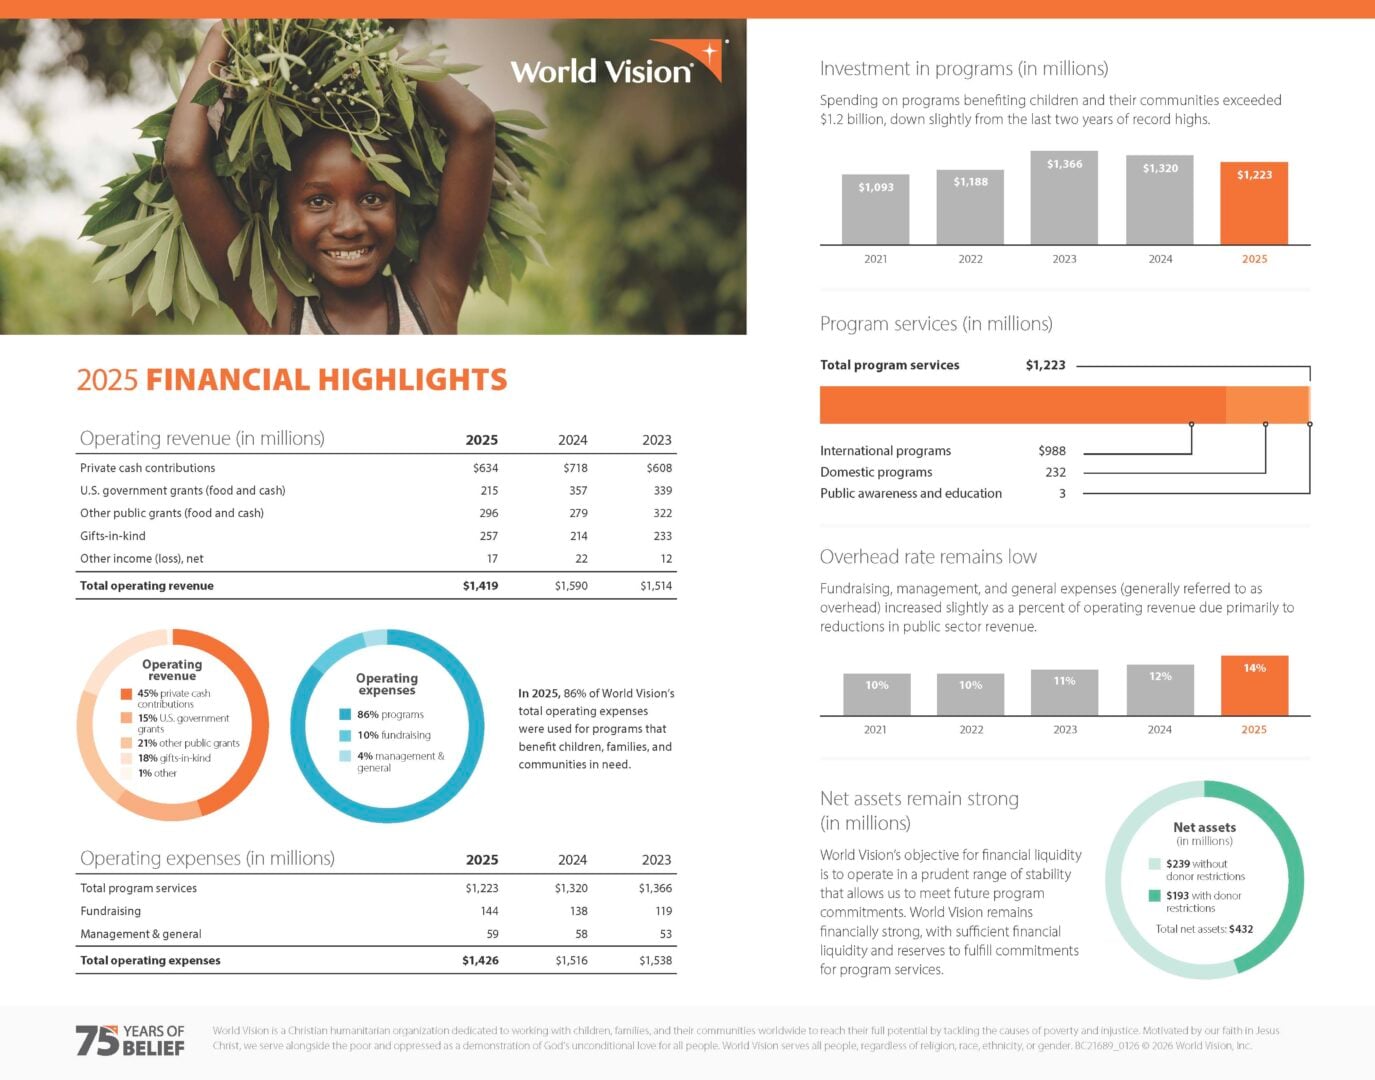
Keeping costs down means your gifts make the most impact possible. In 2025, we invested 86% of our total operating expenses into programs, exceeding industry standards as a charity with financial transparency and efficiency.
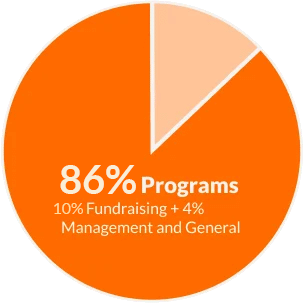
Why 86% is GREAT
Charity Navigator, a leading nonprofit evaluator, recommends that at least 70% of a nonprofit’s expenses be dedicated to programs. World Vision surpasses that benchmark by 16 percentage points—so an even greater share of your gift fuels transformational work.
Dig a little deeper!
For we are taking pains to do what is right, not only in the eyes of the Lord but also in the eyes of man.
—2 Corinthians 8:21 (NIV)
World Vision’s credibility
The resources we receive are a sacred trust from God, through our donors, on behalf of the most vulnerable. Trustworthy charities must have financial transparency, so we are regularly held accountable by independent third-party organizations.
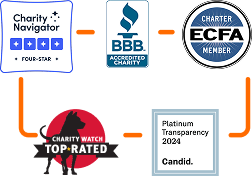
Recognized for excellence
Better Business Bureau
BBB Wise Giving Alliance accredited charity, meeting all standards for charitable accountability.
Evangelical Council for Financial Accountability
Charter member of the Christian association that evaluates compliance with 7 standards of financial stewardship.
Charity Watch
Awarded the Top-Rated Seal from the charity evaluator Newsweek called “the toughest of the bunch.”
An accomplished board of directors also keeps us accountable
Our board of directors works tirelessly and autonomously to ensure that we adhere to our mission, budgets, financial sustainability, and transparency.
Recognized for excellence

Recognized for excellence
BBB Wise Giving Alliance accredited charity, meeting all standards for charitable accountability.
Evangelical Council for Financial Accountability
Charter member of the Christian association that evaluates compliance with 7 standards of financial stewardship.
Awarded the Top-Rated Seal from the charity evaluator Newsweek called “the toughest of the bunch.”
An accomplished board of directors keeps us accountable
Our board of directors works tirelessly and autonomously to ensure that we adhere to Jesus Christ, our mission, budgets, financial sustainability, and transparency.
Investing in lasting change
Since 1950, World Vision has been inspired by Jesus’ teachings to make wise investments for lasting change. And over the decades, we’ve learned and refined our approach. We work with independent, technical experts to monitor and evaluate our programs, so that every dollar is put to work in proven, effective ways.
Impact for generations to come
Child sponsorship
Last year, World Vision sponsors worldwide supported 2.8 million registered children, including 865,000 children supported by U.S. donors.
Clean water and sanitation
We’re the leading nongovernmental provider of clean water in the developing world.
Economic empowerment
We’ve helped millions of families break free from the cycle of poverty.
Faith and development
We annually equip over 50,000 pastors and church leaders with resources and training to show Jesus’ love in their communities.
Emergency response
We are able to respond within 24 to 72 hours to disasters all around the globe.
Impact for generations to come
Child sponsorship
Last year, World Vision sponsors worldwide supported 2.8 million registered children, including 865,000 children supported by U.S. donors.
Clean water and sanitation
We’re the leading nongovernmental provider of clean water in the developing world.
Economic empowerment
We’ve help millions of families break free from the cycle of poverty.
Faith and development
We annually equip over 50,000 pastors and church leaders with resources and training to show Jesus’ love in their communities.
Emergency response
We are able to respond within 24 to 72 hours to disasters all around the globe.
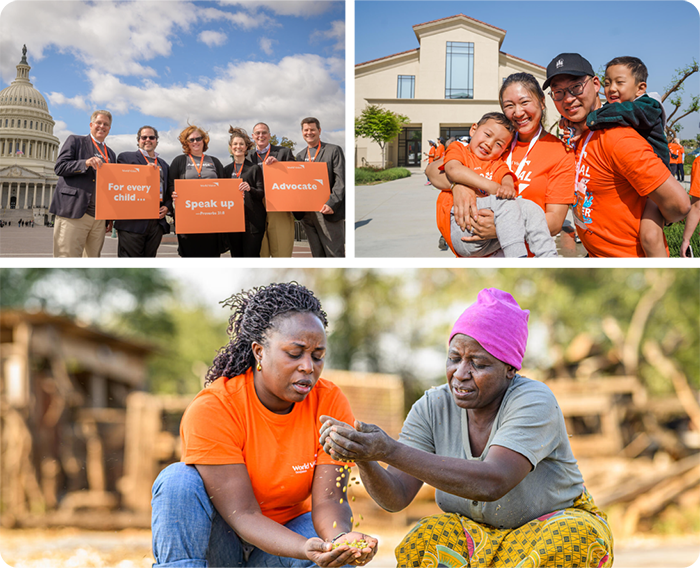
Banding together for good
Lasting change is possible because we work shoulder-to-shoulder with those we serve. We have a presence in nearly 100 countries and a vast network of donors, churches, technical experts, government agencies, and other partners. The result is a diverse revenue portfolio and the ability to maximize donations to do the most good.
Through our proven development model, we work alongside church and community leaders, so the communities we serve can set their own course. They’re equipped with the tools and knowledge to overcome poverty and sustain progress long after we’ve left.
God’s grace plus your generosity fuels this transformation!
There are so many ways to make an impact